Download this page as a PDF or Epub.
Comments or questions? Email us at crispor@tefor.net.
CRISPOR is a website that helps select and express CRISPR guide sequences, described in two papers (Gen Biol 2016 and NAR 2018). In its default mode, the user pastes an input DNA sequence and chooses the genome. CRISPOR then lists the guides in the input sequence, adding information about them found in databases and algorithms, including genome variants, predicted off-target and on-target scores. For each guide sequence, various primers are designed, e.g. to amplify the target, produce guide RNAs by in vitro transcription after annealing of overlapping primers or for cloning into AddGene plasmids.
A second, optional mode, called CRISPOR Batch, is available for users who want to use pre-selected guide RNAs for gene inactivation experiments in mouse or human cells. It accepts one or multiple gene identifiers and returns a number of pre-selected guides from various genome-wide libraries as well as primers with overhangs for cloning into guide RNA expression plasmids and with sequence information preformatted for easy ordering from oligo-array manufacturers.
Additional assistants in CRISPOR design primers for all predicted off-targets of a guide and create oligonucleotide pools for saturating mutagenesis of the input sequence.
Below, we provide a step by step manual of CRISPOR and instructions on how to use the assistants. Important information is also directly available on the web pages by hovering the mouse over the small info bubbles shown in orange. Usually, orange colour indicates links which can be clicked for further information or more detailed CRISPOR results.
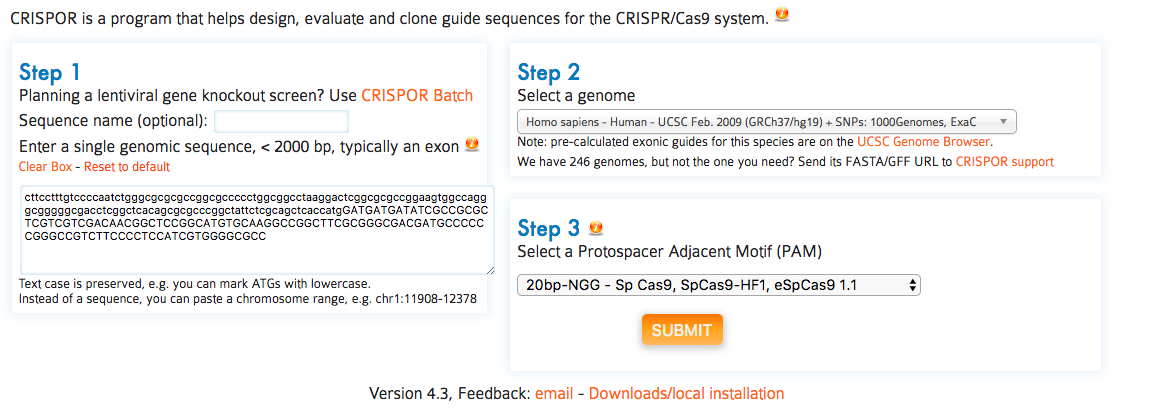
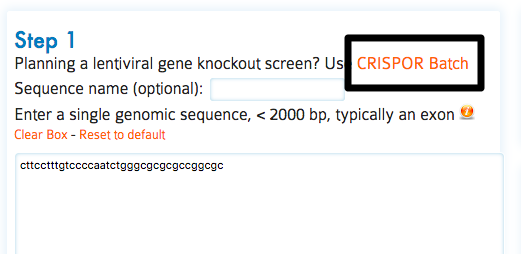
On the first page of CRISPOR.org, you have to enter only three pieces of information:
Input Sequence: paste your target sequence into the input sequence box. No special sequence format is required (FASTA accepted). Characters other than A, C, G, T and N will be automatically removed from the pasted sequence. A warning will be displayed during processing if characters were removed.
Genome: Select your genome of interest from the list. You can scroll through and select from the drop-down or type and search the names of the species, using latin or English common names.
Protospacer Adjacent Motif (PAM): For most current applications of the CRISPR-Cas system, Streptococcus pyogenes Cas9 nuclease is used and the corresponding PAM is NGG, the default. However, you can choose other enzymes and corresponding PAMs from the dropdown box.
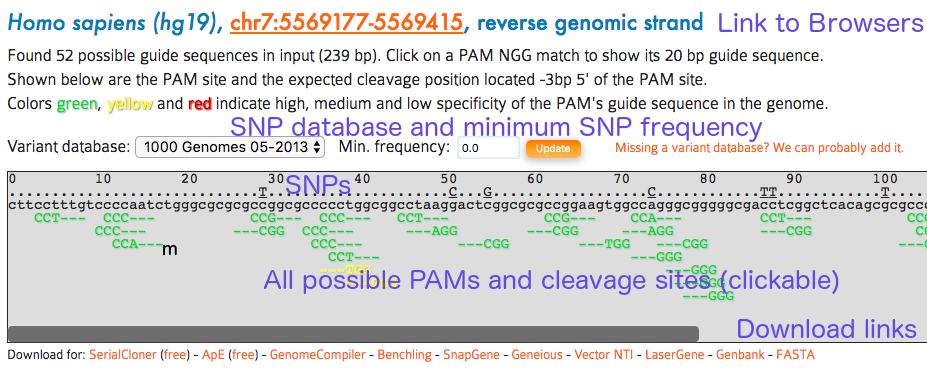
The main output of CRISPOR is a page that shows the annotated input sequence at the top and the list of possible guides in the input sequence at the bottom.
The input sequence is shown first. Underneath the sequence, all PAM (Protospacer adjacent motif) sites are highlighted. Most labs use Sp-Cas9, its PAM is NGG. Sp-Cas9 usually cuts three or four basepairs 5‘ of the PAM site. The three bases 5’ of the PAM are marked with dashes (“-”) to help users find the cleavage position. PAM sites can also be on the reverse strand of the input sequence. For Sp-Cas9, these correspond to CCN motifs on the input sequence and the dashes are shown on the right side of the PAM in this case. PAMs are clickable and link to the corresponding target row in the table of guides below (see next section).
you can send the URL of the output page to collaborators or bookmark it. We have not yet deleted any results over the last two years and try to keep the output for at least a year. For long-term archival, consider downloading the page and/or the Excel spreadsheets.
very few genomes (human and mouse) have variants in our database at the moment. If you need a particular one, contact us by email and send us the URL of the database or the VCF file.
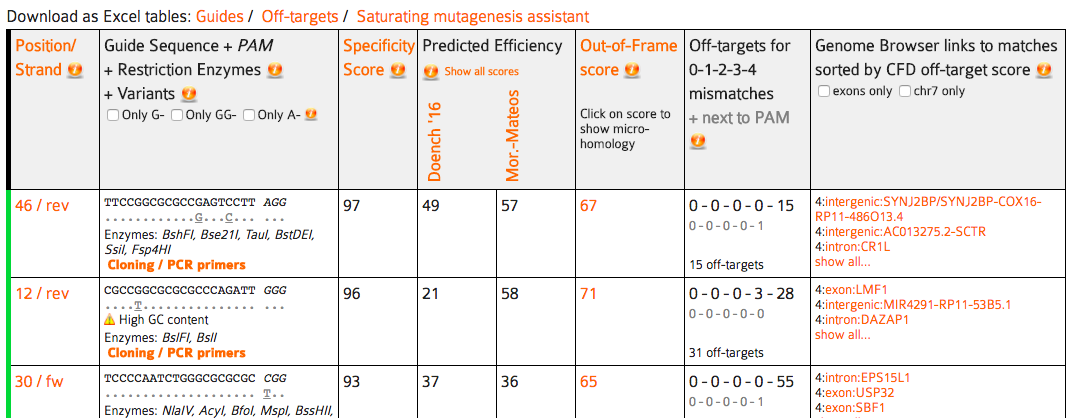
Shown below the input sequence are the guide target sequences, one per PAM. For spCas9, the PAM is NGG and the targets are 20bp long. Each 20bp target sequence in the input sequence is aligned against the whole genome allowing at most four mismatches and the results are summarized as a table. The table has the columns described below. To sort by one of them, click its name in the first row.
By default, the table rows are sorted by specificity score. To sort by values of any other column, click the name of the column in the first row.
Column 1 - guide name: this is the position of the PAM on the input sequence and the strand, e.g. “13+”. You can sort by position by clicking the header “Position/Strand” in the table. The position is always on the forward strand of the reference genome, 5’-3’ on the DNA, so if the input sequence is on the reverse strand, position 1 in this table will be the last base pair of the input sequence. (In general, we do not recommend entering sequences on the reverse strand. it makes everything easier if you always keep genomic sequences on the forward strand, even if transcription can go backwards, CRISPR modifies the genome and having all sequences in one direction makes any position information easier to calculate in your head and to display in genome browsers and related tools.)
Column 2 - guide sequence: the sequence of the guide target and the PAM and also one of the most important features of CRISPOR, the link to its “PCR and cloning primers” (see the Primers section below).
In addition, depending on the genome and guide, additional data is displayed in the guide sequence column:
This column allows to filter the guides by the first nucleotide, as some RNA expression promoters can only transcribe guides that start with certain nucleotides. Some labs only use targets that start with G- for the U6 promoter, A- for the U3 promoter or G- for the T7 promoter. In this way, no further sequence changes are necessary. In our lab, we do not constrain guides in this way, but simply prefix them with the required nucleotide as a 21st basepair (see the Primers section below).
Column 3 - specificity score: this score is a prediction of how much an RNA guide sequence for this target may lead to off-target cleavage somewhere else in the genome. The score ranges from 0-100 with 100 being the best, meaning the search could not find a single sequence in the genome that differs from the target at up to four positions. This score uses the formula from the MIT Crispr Website (Hsu guide score) but with a better and more sensitive search engine. We think that good guides should have a specificity score of at least 50, based on the data from whole-genome off-target assays, see Figure 3a in the CRISPOR paper. The color of the guide (red/yellow/green) is based on the specificity score (>50 = green, >30 = yellow). You should avoid guides with very low scores, unless you can validate the off-targets with special assays or you can cross or inbreed the animals until you are sure that no off-targets are left. SaCas9 now has its own specificity score provided by Josh Tycko, so this column will appear for SaCas9, but there is no such score for Cpf1 yet.
Column 4 - efficiency scores: the efficiency score is a prediction of how well this target may be cut by its RNA guide sequence. It ranges from 0-100 with 100 being the best. We show two scores here: the scoring method from the Doench 2016 paper (aka “sgRNA Designer”) or the one by Moreno-Mateos 2016 (“CrisprScan”). In our study, we found that the Doench 2016 score is the best score for guides expressed in the cells from a U6 promoter, see Figures 4 and 5 in our CRISPOR paper. The Moreno-Mateos2016 score was better in our study when the guide was expressed in-vitro with a T7 promoter. While there is link in the header of this column to show various other scores in the table, we do not recommend the other algorithms anymore, based on the results from our paper. Note that the Doench 2016 scores slightly changed in April 2018, when we updated to the version called ‘Azimuth’, which is also used by the Broad Institute’s website, but the changes were on the order of 1-2%, so it did not make any difference in practice.
Cpf1 and saCas9 have special efficiency scores, the spCas9 scores are not applicable for them, and the models “deepCpf1” for Cpf1 and “Najm et al 2018” for saCas9 will be shown here.
Also, the predictive power of these scores is not great in general, with correlations of around 0.4 against the assay results. If you have no choice and need to pick certain guides, you may choose to ignore efficiency scores. If you have a choice between many specific guides, however, or you are screening many guides, you may want to prefer guides with high efficiency scores. For a more detailed discussion of this topic, see our Notes on on-target cleavage below.
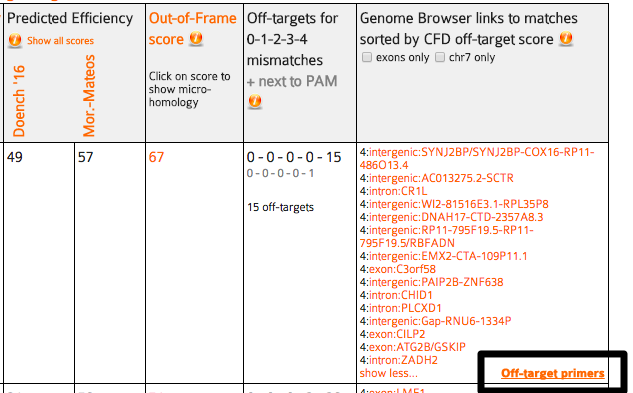
Column 5 - out-of-frame score : this score (0-100) is a prediction how likely a guide is to lead to out-of-frame deletions. This is relevant if you are doing gene knockouts with a single guide. Gene knockouts with single guides work because repair after DNA cutting is error-prone and small deletions are introduced 5’ of the PAM. It has been observed by Bae et al. that this repair does not lead to a random distribution of small deletions, but that due to microhomology around the cut site, certain deletions are favored, depending on their flanking DNA sequences. You can click on this score to show what the predicted deletions are, in order of their predicted microhomology. We know of at least one case where it was impossible to obtain a gene knock-out with a specific guide because all deletions seen after sequencing were always in-frame (T. Momose, unpublished data). The higher the out-of-frame score, the more deletions have a length that is not a multiple of three, see Bae et al..
Column 6 - off-target mismatch counts: the number of possible off-targets in the genome, for each number of mismatches. This is a summary of the whole-genome search for sequences similar to the guide target sequence. It is best explained by an example: a description “0 - 1 - 2 - 9 - 28” means that the target matches 0 locations in the genome with no mismatch, 1 location in the genome with 1 mismatch, 2 locations with 2 mismatches, 9 with 3 and 28 locations with 4 mismatches. The smaller numbers in grey below use the same scheme, but only for locations with no mismatch in the 12 bp close to the PAM, the “seed” region. Early reports based on in-vitro cleavage assays suggested that off-targets with a mismatches in the seed region are very inefficiently cut. If the grey numbers are “0 - 0 - 1 - 7 - 2” this means that there is one location in the genome where the target matches with three mismatches and all three mismatches are outside the seed region, 7 locations with 4 mismatches outside the seed region and 2 locations with four mismatches outside the seed region. The total number of off-targets is shown in this column, too. For detailed discussion of the topic of off-target searching, see our Notes on off-target cleavage below.
Column 7 - off-targets: here CRISPOR lists the locations of all possible off-targets with up to four mismatches, annotated with additional information: - genomic position and an annotation whether they fall into an exon, intron or between genes and the closest gene. - you can hover with your mouse over the position to show an alignment of the guide sequence with the off-target and two off-target scores, CFD (Cutting frequency determination) and MIT.
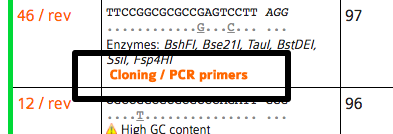
The third main page of CRISPOR is the list of primers related to a selected guide. You reach it by clicking “Cloning / PCR primers” for a particular guide in the table.
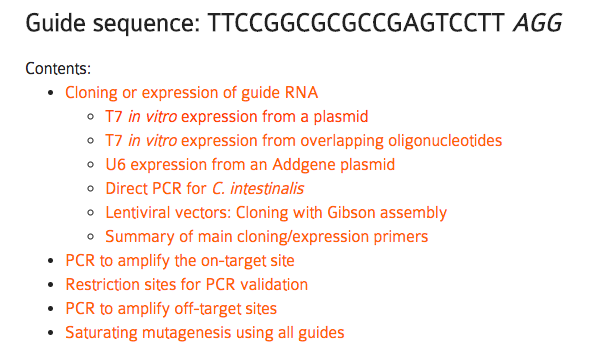
The top part of the page (“Cloning or expression of guide RNA”) shows expression primers. There are many possible ways for guide expression supported by CRISPOR. The choice depends on your organism (mice/zebrafish vs. cell cultures) and preferred cloning method. We tried to link to useful protocols on this page, too. If this page is missing support for your favorite system or protocol, do not hesitate to contact us. For quicker copy/pasting into Excel, this section contains a table with a copy of all primers at the end (“Summary of main cloning/expression primers”).
The second part of this page (“PCR to amplify the on-target site”) shows one pair of primers to amplify a fragment of the genome around the target site, to validate cleavage, e.g. with the T7 endo assay, by analyzing your Sanger traces with TIDE or ICE, NGS sequencing analyzed with Crispresso or by restriction digest (see below). You can change the size of the fragment and the Tm of the primers here to optimize the PCR design to the specific assay.
The third part of this page (“Restriction sites for PCR validation”) lists restriction enzymes that overlap the position 3bp 5‘ of the PAM. If a PCR product of the primers above is not cut with the enzyme anymore, it is very likely that the genome had been changed by Cas9 successfully, usually with a short deletion. This is quicker in the lab than sequencing or T7 endonuclease assays and can be very useful for routine screening during breeding of mutant animals.
To make sure that your restriction site is unique enough in the PCR fragment to be visible on a gel, the sites are shown on the PCR fragment sequence shown below. The sizes of the individual sub-fragments are shown, too.
Finally, there are links at the bottom of the page to design primers for all off-targets of this guide (see next section) and also a link to download all guides in the input sequence for saturating mutagenesis, e.g. of non-coding regions (see below).
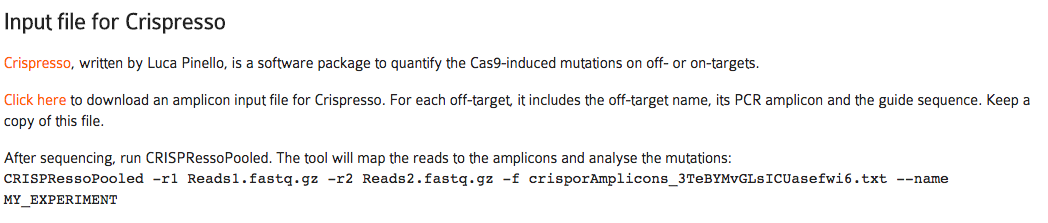
High-throughput sequencing is the most accurate way of determining off-target cleavage. By ordering oligos and running arrayed PCRs e.g. on 96-well plates, you can validate up to several hundred off-targets relatively quickly. The off-target primer designer of CRISPOR outputs not only one pair of primers for each off-target with the right overhangs for Illumina adapter addition, but also creates an input file for CRISPRESSO. CRISPRESSO (http://crispresso.rocks) is a software package for the analysis of FASTQ files from sequencing, it can e.g. plot histograms with the distribution of indels 5‘ of the PAM site and calculate p-Values for them.
For off-target amplification, we recommend the protocol by Matt Canver where two PCRs are run: one PCR to amplify the potential off-target, then a second PCR to extend the handles with Illumina barcodes. You can download the protocol here.
You reach the off-target primer designer by fist clicking “show all” in the list of off-targets, then following the link “Off-target primers”. At the top of the page, a table with one pair of primers for every predicted off-target is shown.
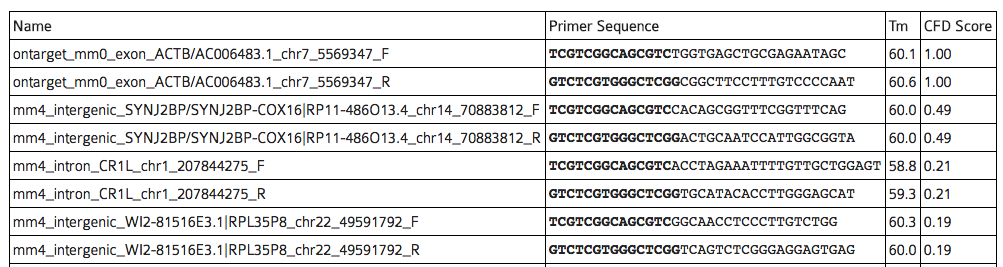
In the table of primers output by CRISPOR, Illumina Nextera Handle sequences have been added and are highlighted in bold. Primers for the on-target sequence have been added for convenience. The table is sorted by the CFD off-target score. Note that sites with very low CFD scores < 0.02 are unlikely to be cleaved, see Figure 2 of our CRISPOR paper, but they are still shown on this table. All primer names are prefixed by the number of mismatches, e.g. “mm4” is an off-target with four mismatches. Naturally, each off-target has two primers, indicated by the common suffixes “_F” and “_R”.
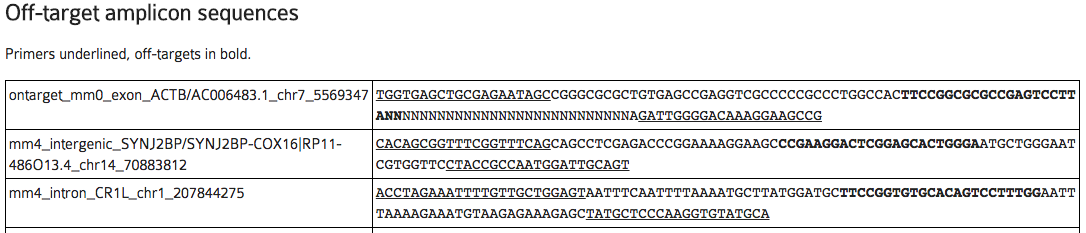
The primer designer also outputs a table of the amplicons with the putative off-target sequence highlighted in bold.
Finally, at the end of the page, you can download CRISPRESSO input files and the exact command line to analyze your FASTQ sequencing result file.
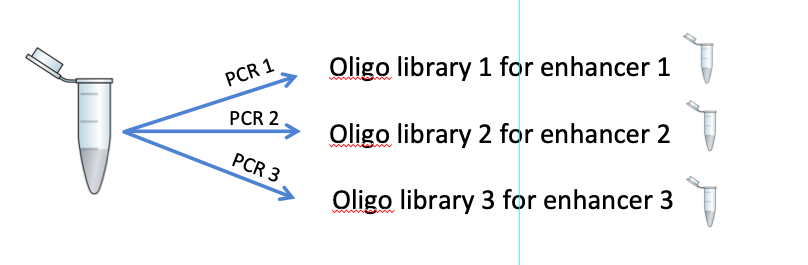
In a saturating mutagenesis experiment, a target region of the genome is modified with many guides, to create as many DNA edits as possible. Cells can be transfected with a pool of oligonucleotides (“pooled”) or one guide per cell sample on plates (“arrayed”) and are then phenotyped. This assay is usually used for cis-regulatory regions, to find the relevant sequences for a phenotype. Pools with up to several thousand guides can be ordered from custom oligonucleotide array manufacturers, containing subpools of guides that can induce thousands of deletions into a target sequence.
To save money, you usually order several libraries together as a single pool. Each library has a unique barcode and you can amplify a library from it with PCR and the unique barcode as a primer.
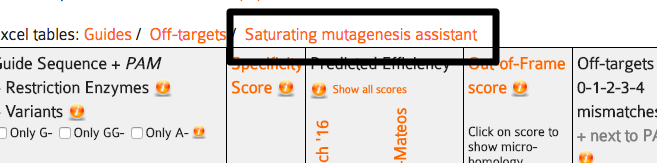
The CRISPOR Saturating mutagenesis assistant makes this much easier by generating tables with all relevant guides in a target sequence, prefixed with the right adapter sequences, input files for CRISPRESSO to quantify the guides (see off-target primers) and sequencing primers to validate the modifications.
For step-by-step details on how to conduct this assay and use this assistant, please refer to our pre-print, Canver et al. 2017, to appear in Nature Protocols in 2018.
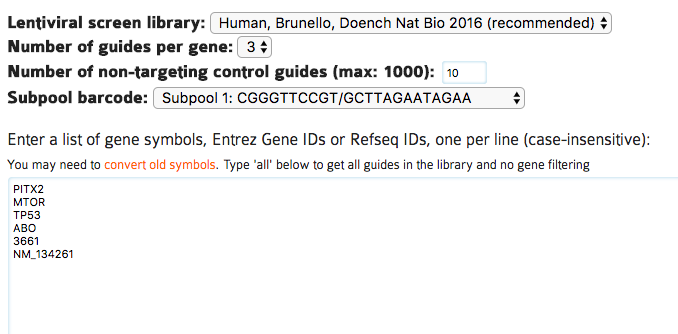
Pooled CRISPR screens can be used to knock-out thousands of genes with a single experiment. CRISPOR Batch makes the design of an oligonucleotide pool very easy: paste a list of genes, then download a table of oligonucleotides. We currently only offer this for human and mouse, let us know if you need another organism. We also do not design the oligonucleotide libraries but instead offer existing and tested sequences from published libraries. To reach CRISPOR batch, follow the link to it from the main page.
Select the CRISPR library, the number of negative controls, the number of guides you need per gene, then paste a list of gene gene symbols, Entrez Gene IDs or Refseq IDs, one per line into the box below.
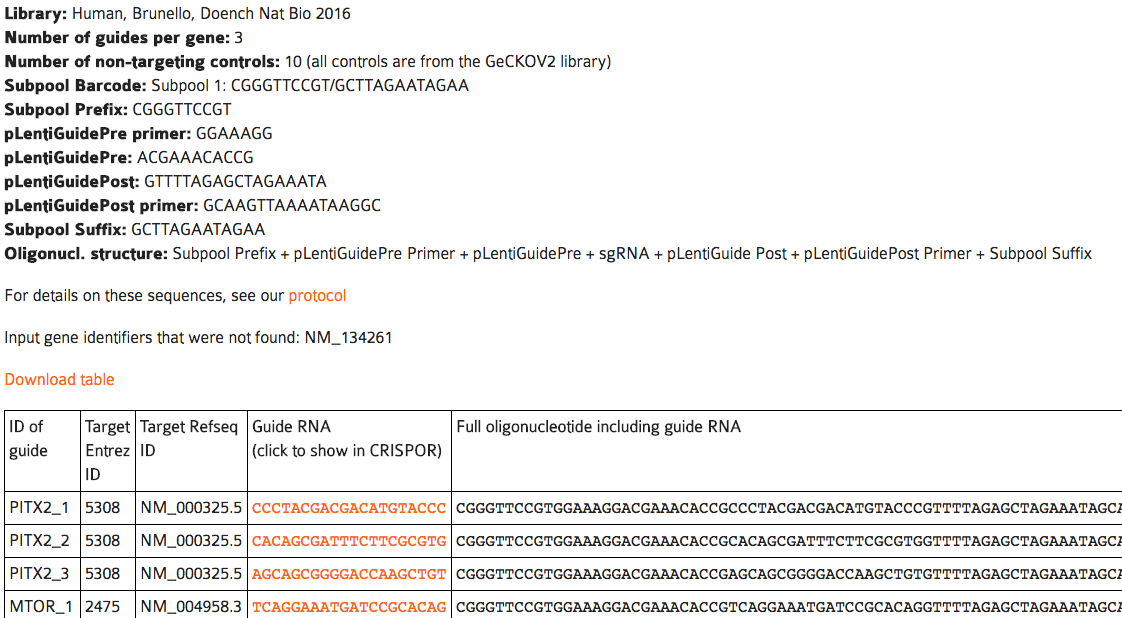
The output page contains a table with one row per guide, for up to the number of guides per gene that you selected.
A note on money: pooled screens may seem like an expensive assay, but at current prices you can get twelve thousand oligos for < 2000$ and the pool can easily be split into smaller subpools by PCR. In addition, there is a lot of competition in this field. Our collaborator Matt Canver uses CustomArray which says they will beat any quote. If you order through Twist Biosciences, mentioning CRISPOR will get you 35% off your order (we do not receive kick-backs from them, unfortunately).
Off-target effects are a somewhat controversial topic. On the one hand, cleavage at unintended locations in the genome is a major concern, it is important enough to get mentioned in newspaper articles and has lead to stockmarket changes and calls for study retractions. On the other hand, if you are working with mice, worms or flies, and you are breeding out for a few generations after your genome edits, then you are probably not worried at all, as unrelated mutations are most likely get removed over time. In this case, you can probably skip this section, just avoid guides with very low specificity scores and possibly use the “same chromosome” filter in column 7 of the guide list to show only off-targets that are on the same chromosome, so less likely to get removed by back-crossing.
For other researchers, e.g. those that use mice without further inbreeding or work on cell cultures or on medical applications, the off-target issue needs to be addressed. Here is a quick summary of what is relatively well-known about off-targets:
CRISPOR aligns the guides against the genome, reports those locations with a similar sequence in the genome (“predicted off-targets”), ranks these and then based on their scores, ranks the guides.
When predicting off-targets, CRISPOR searches the whole genome (including repeated regions) and allows up to four mismatches. It is important to search repeats, as they are part of the genome, but you may wonder why we chose four mismatches. When we looked at real off-targets, around 90% of them had not more than four mismatches. While you can increase the number of allowed mismatches using the command line version of CRISPOR to five or even six mismatches, the large majority of the predicted locations will be false positives, and most guides would require thousands of PCRs to check all predicted off-targets with more than four mismatches. See Figure 1 of the CRISPOR paper.
CRISPOR then ranks the putative off-target sequences by a score called “CFD”, created by John Doench and colleagues in his 2016 paper. We have evaluated four different scores in (Figure 2 of the CRISPOR paper) and found the CFD score more accurate than the others.
CRISPOR summarizes all of the putative off-target sites it finds in the genome for one guide into the “guide score”, a formula we copied from the MIT CRISPR website. The “Hsu” score itself was never published, but is based on data from a paper by Patrick Hsu. While we use Patrick Hsu‘s formula like the MIT site, CRISPOR searches go up to four mismatches, and the MIT website uses three mismatches and does not search repeats, so the guide scores are not exactly identical. CRISPOR is more sensitive, but in practice most guides with a low score on the MIT website will also have a low score with CRISPOR. The commercial solutions Benchling and DeskGen are also less sensitive, so their scores differ, but ChopChop and Cas-OffFinder should give identical off-target results to CRISPOR.
So how many off-targets should you expect? We studied this question in Figure 3 of the CRISPOR paper. It is based on 30 guides that were tested for off-targets with high-throughput assays by various labs.
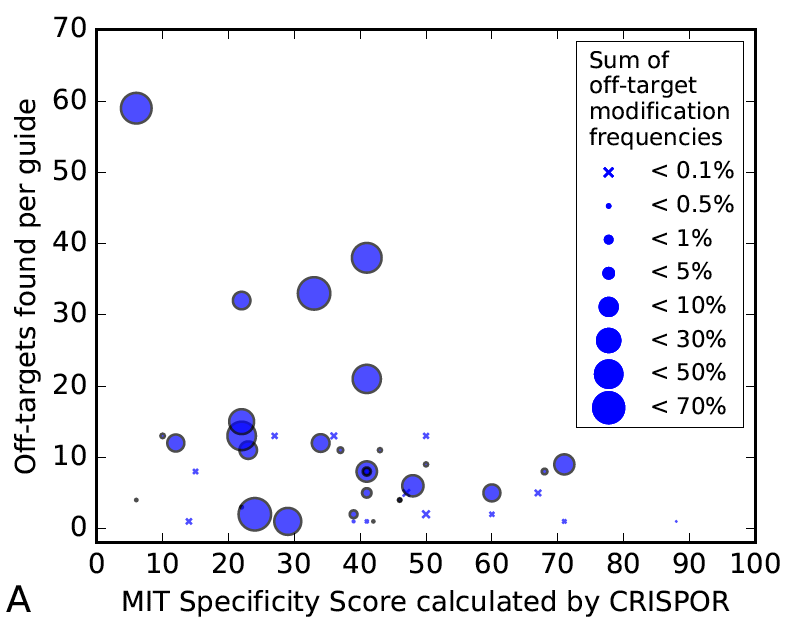
The figure shows that there are some guides that have virtually no off-targets, but in general, there is a decreasing tendency of strong off-target effects when the specificity is higher. It also shows that too many tests have been done for low-specificity guides, which may explain why you have heard from colleagues that hundreds of off-target sites are common. It also shows that the accuracy of the prediction is not great, the current predictions have some value, but there is no guarantee that you can avoid off-target effects with a software like CRISPOR alone.
Therefore, if you are worried about off-target effects, you can either test your guide for off-targets with a high-throughput technique in cell cultures ( e.g. guideSeq or DiGenomeSeq2), which will require learning a new assay. The alternative is to test predicted off-target sites by a simple PCR and next-generation sequencing (or use TIDE, knowing that it will not find the weaker off-targets). For a highly specific guide, this may involve only a few dozen PCRs and CRISPOR‘s Off-target primer designer makes their design very easy. This is the other good reason to use only very specific guides: you can screen all predicted off-targets by PCR.
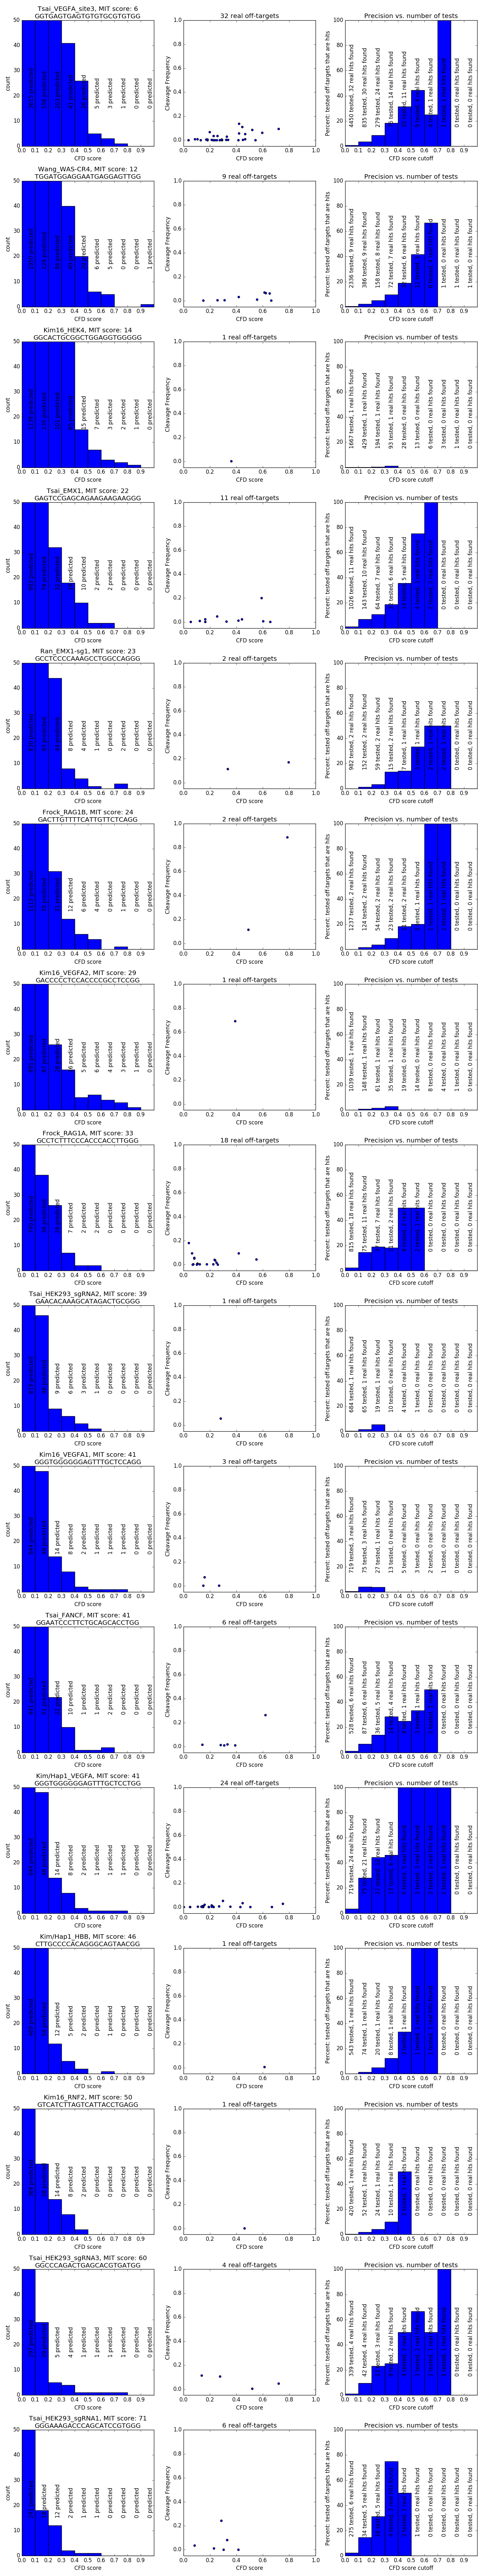
How many off-targets should you test, especially since there are often hundreds of predicted sites and only very few real off-targets among them? There is not enough data to answer this question completely, but here are a few examples (complete histograms):
It seems that if your guide has a reasonable specificity score, testing one 96-well plate of primers should find most off-targets.
Should you use a high-fidelity version of SpCas9, eSpCas9 1.1 or HF1? If you are worried about off-targets, then probably yes. Just do not be surprised that these enzymes are less efficient on many target sites or may not even be able to cleave some target sites at all. If you use them, you may want to try both enzymes or be ready to fall back to the original SpCas9. Kulcsar et al. 2017 have studied this topic in detail and shown that there is a ranking from the best to the worst enzyme in terms of efficiency, but the order was different for every target site they tested.
On-target efficiency, the percentage of cells with a DNA modification of the target sequence, can vary a lot between guides. The general recommendation is to first test several guides, often three, around a target sequence and then use the best one. Quite a few labs have looked at their CRISPR results post-hoc to determine features of their most efficient guides. Initially, these were rules, derived from smaller worm or fly datasets, and lead to guidelines like “prefer guides with Gs at the 3’ end”. Later, pools of thousands of guides were tested in cell cultures or, one by one, expressed in-vitro and injected into zebrafish. The results of these assays were run through machine learning algorithms to build models that predict the efficiency from on the guide sequence alone.
In our CRISPOR paper we conducted the most comprehensive comparison of these prediction models at the time. No matter the model, their value is limited, they can explain only ~40% of the variation between different guides. The unexplained part does not seem to depend on the chromatin structure or the other possible factors that the studies have tested. Therefore, when looking at your own results, if you compare only a few guides, you may not see a significant correlation of your results against the prediction scores. In addition, if you use a very inaccurate method to quantify your efficiency, like the T7 endo assay, many differences will not be visible. Finally, according to a Synthego slide deck, synthetic RNA guides do not seem to have this link between sequence and efficiency at all (watch this space, we will follow up on this soon).
Nevertheless, if you plan to test more than just a few guides, the efficiency prediction scores do enrich for more efficieny guides. We found that there is one important parameter when choosing a score, it is the way you express your guides. T7 in-vitro expressed guides - injected into e.g. mouse or Xenopus eggs - behave very differently from U6 guides expressed from plasmids that have been transformed into cell cultures. In our analysis, the score by Moreno-Mateos et al. worked better for T7 datasets, and the one by Doench et al. 2016 was best for U6 datasets, see Figure 5 of our CRISPOR paper paper.
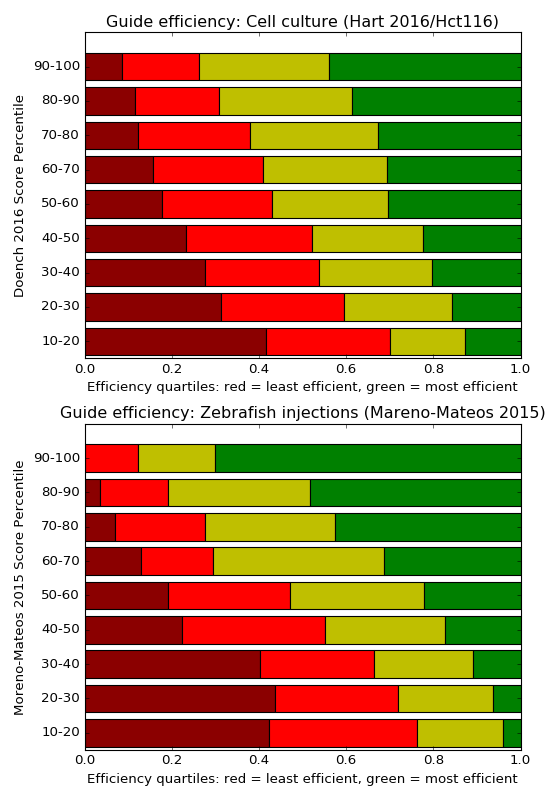
The influence of the efficiency score on the measured cleavage is shown in the diagram below: the y-axis shows the Doench2016 score range and next to each range, a histogram illustrates how many of the tested guides in this range where among the top 25% efficient guides (green) and how many where among the bottom 25% guides (red) in the whole dataset. Light-red and yellow are the intermediate quartiles. You can see that when guides were tested in the 90-100 score range, very few of them were in the least efficient quartile. In the 10-20 score range, a majority of guides were not very efficient. This is not due to “over-fitting”, because the diagram shows the Hart 2016 experiment, which was not published yet when Doench 2016 was accepted.
The lower diagram shows the same for zebrafish data, but since the dataset from the same authors is plotted here, the results are probably too good and should be somewhat worse in practice, more like the cell culture diagram.
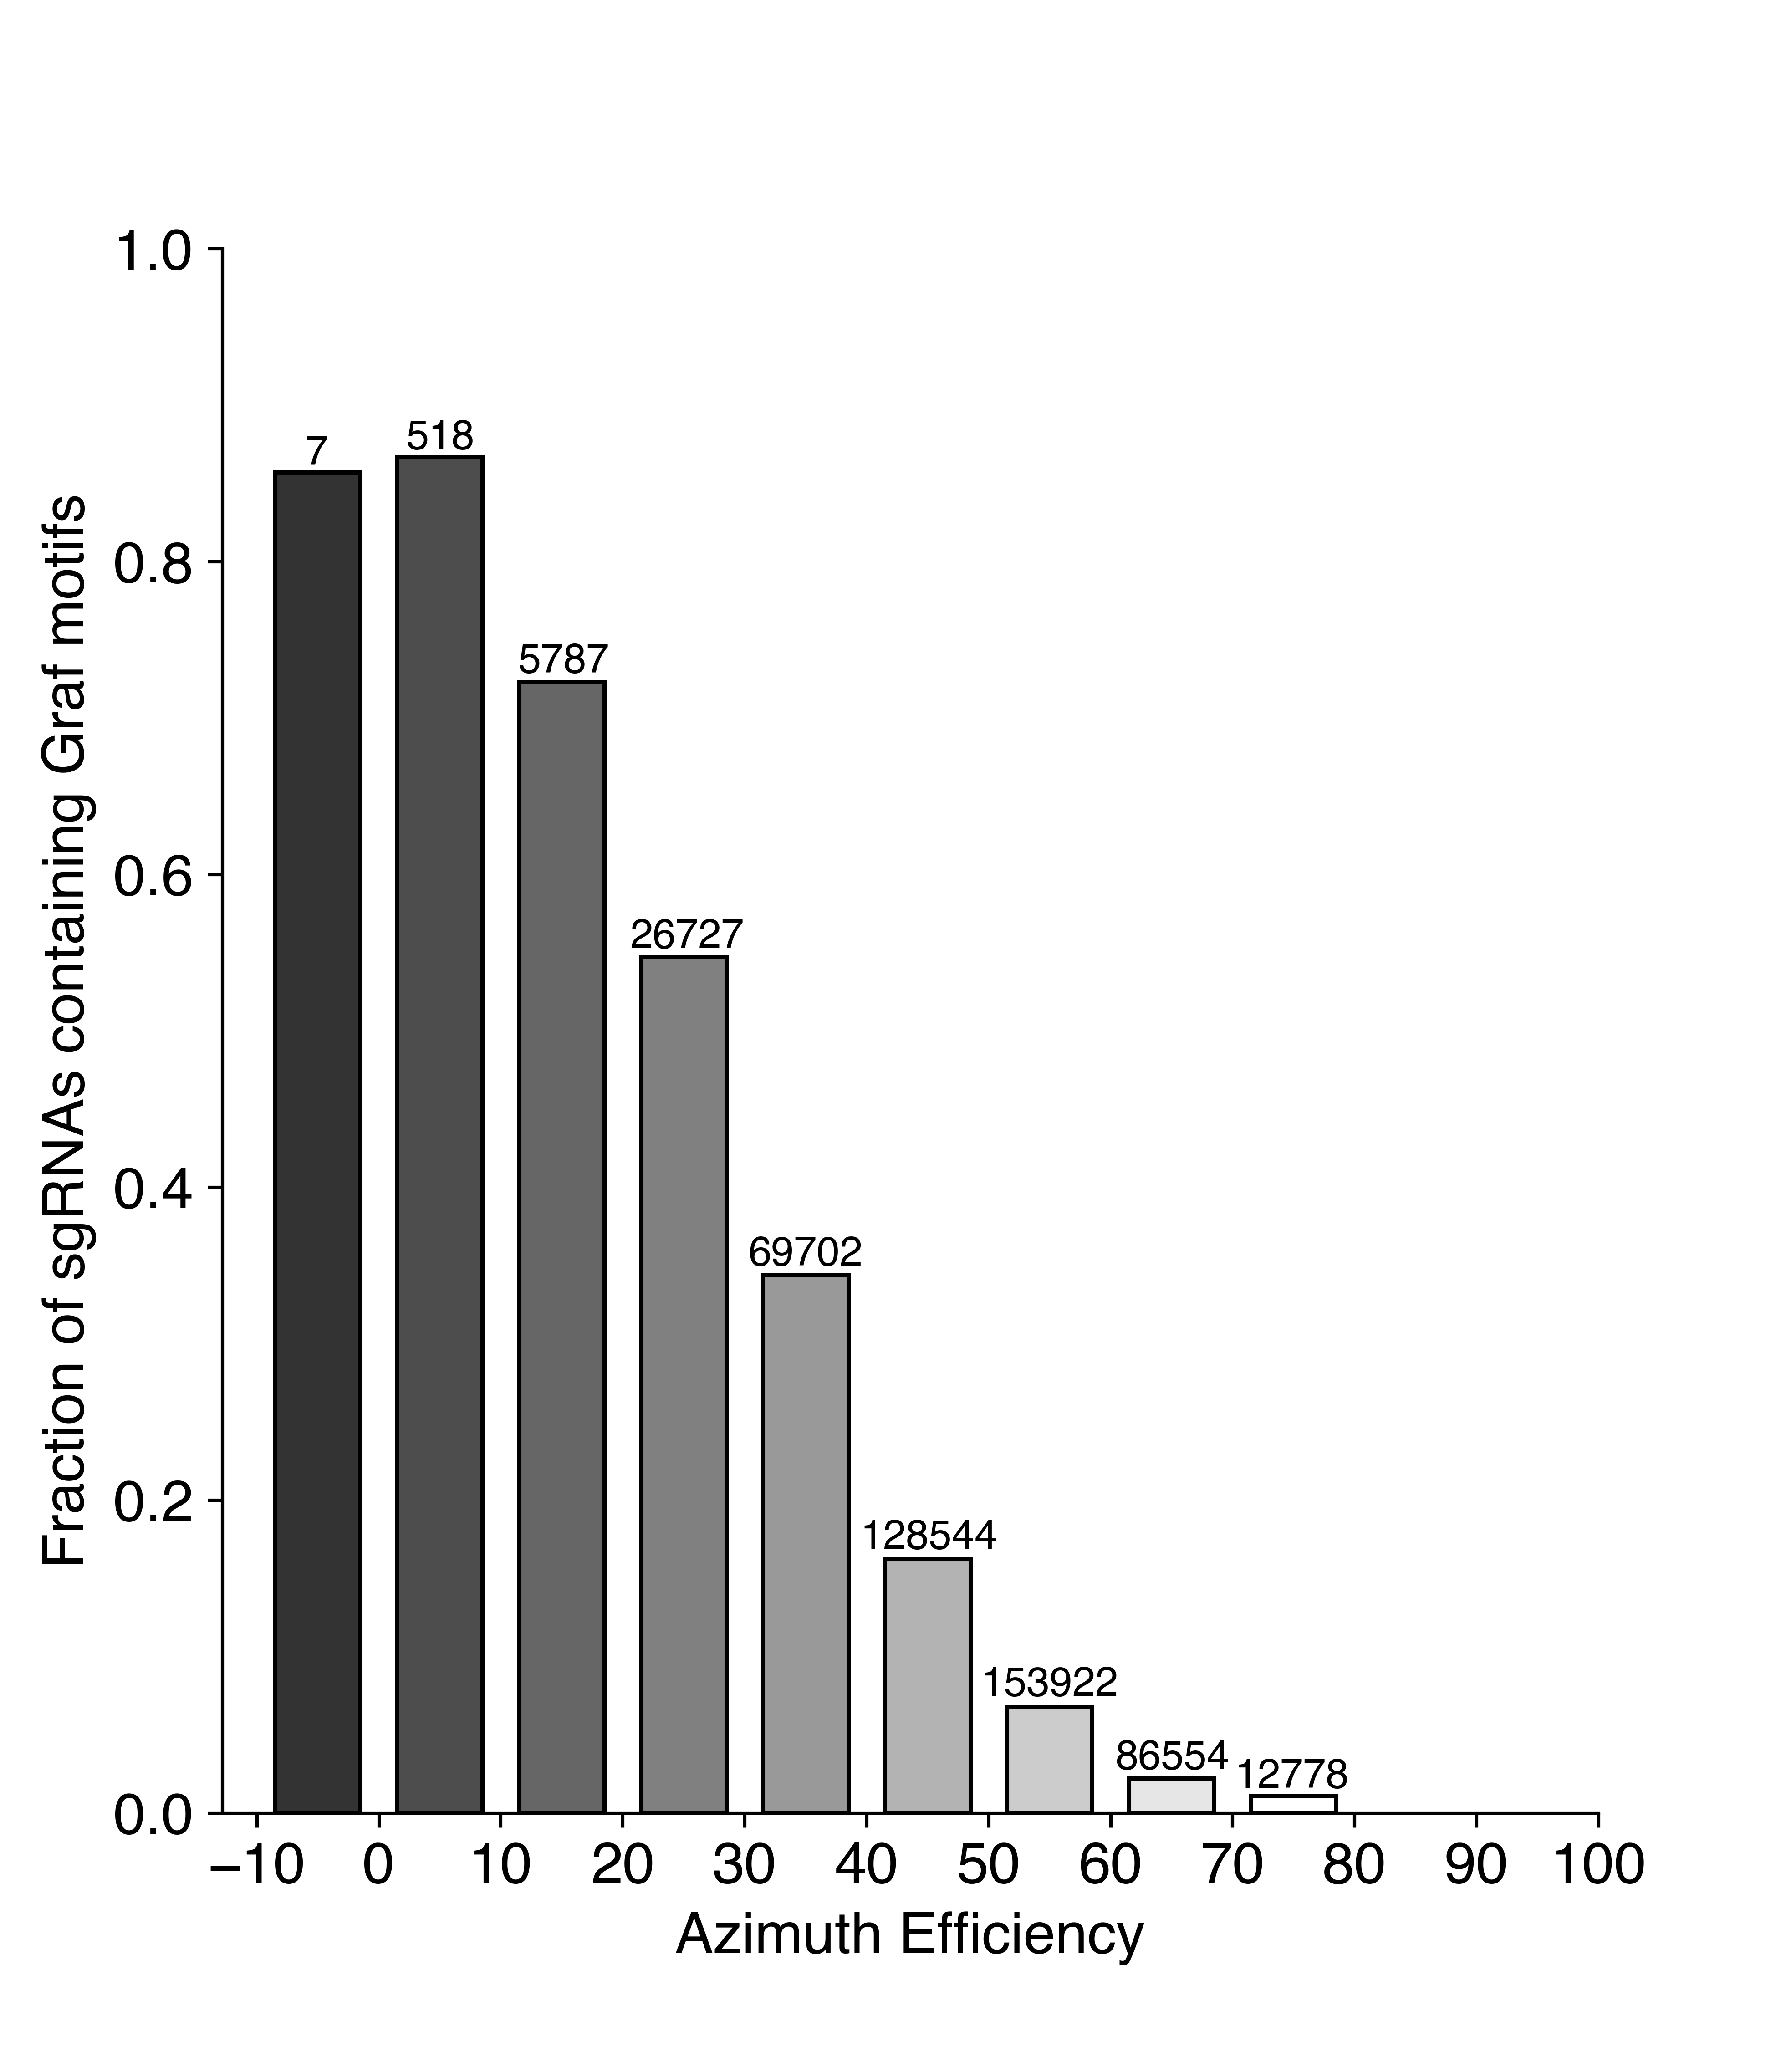
{#graf} A special case of efficiency scoring are the Graf et al motifs. The authors claim that certain nucleotide sequences (two to 16, depending on how you count) at the end of the guide lead to extremely low efficiency. This is already captured by the efficiency scores, as shown below. But the simple nature of the Graf et al. motifs makes these guides easy to avoid.
So while you may have heard that efficiency predictions are of little value, we still recommend them. They should save screening time in the long run as they decrease your chances of stumbling over a very inefficient guide. Just make sure that you look at the right score for your expression system.
SpCas9: the CRISPR workhorse and best-described enzyme. A good choice for NGG sites. In CRISPOR, only NGG PAMs are shown on your input sequence but for off-targets, the rest of the genome is searched not only for NGG but also for the additional “non-canonical” PAMs NAG and NGA. Based on the results of off-target screens, the scores of a non-canonical off-target site is divided by 5 to make up for the lower efficiency of these PAMs and the total MIT and CFD specificity score is calculated from the sum of all off-target scores. If the total, adapted off-target score of a non-canonical site if lower than 1.0, the off-target is not shown at all. This treatment is based on the guideSeq results and very conservative. No known off-target out of more than 700 have ever been shown to be cleaved at such a low score. The filter reduces a lot the list of off-targets that are shown though. If you have an application where you really absolutely need all possible sites, please contact us.
Cpf1/Cas12a: an ideal choice for AT-rich sequences. The main PAM is TTTV, but CRISPOR allows TTTN for non-canonical off-targets. The score of non-canonical off-targets is not corrected, as there is little off-target data. The original paper described 23bp guides. For higher efficiency, 21bp guides are recommended by IDT on the Cpf1 product page, Figure 3, in the “performance” section.
xCas9: While this enzyme recognizes the NGN PAM, many of these target sites are not very efficiently cleaved. The most efficient sites include the PAM NGK. Therefore, CRISPOR offers both options, NGN and NGK. Note that when you choose the NGN PAM, CRISPOR also shows GAW sites, because the original paper described this as being almost as efficiently cleaved as NGN by this enzyme.
enCas12 E174R/S542R/K548R (Kleinstiver et al Nat Biot 2019): a derivative of Cas12a with the PAM TTYN, but recognizes a set of other motifs: TTYN-, VTTV- and TRTV. CRISPOR shows all three sites on the input sequence and for off-targets. Because little is known about the off-targets of this enzyme for now, CRISPOR does not correct the off-target score depending on the motif, which differs from the treatment of non-canonical motifs NAG/NGA for spCas9.
SpG: An engineered variant of SpCas9 that recognizes NGN PAMs. It is reported to have higher activities across most NGN sites compared to SpCas9-NG and xCas9. When targeting sites with NGG PAMs, wild-type SpCas9 is still recommended. For more details, see Walton et al. Science 2020.
BhCas12b V4: The PAM is ATTN, but for off-targets CRISPOR allows TTTN and GTTN.
SpRY: SpCas9 variant with highly relaxed PAM requirement. SpRY is reported to efficiently target sites with NRN PAMs (where R is A or G) and less efficiently target sites with NYN PAMs (where Y is C or T). When targeting sites with NGG PAMs, wild-type SpCas9 remains the most optimal choice. Similarly, SpG remains a preferred option for most NGN PAMs. Otherwise, SpRY should offer the greatest probability of targeting other PAMs. For more details, see Walton et al. Science 2020.
If you need a genome that is not already in the our list, please send us the UCSC genome name or the Ensembl taxon ID or the NCBI RefSeq Assembly ID, which starts with GCF_ or GCA_. GCF_ genomes come with gene models, for exon filtering, GCA_ accessions do not, so when in doubt, prefer GCF_ genomes. You can find these numbers by searching NCBI Assembly for your genome of interest. We can exceptionally also add individual FASTA and GFF files, which you can send by URL or as a Dropbox link. We have received more than 150 genomes from users by email until now, mostly using NCBI RefSeq genome accessions.
Because these other tools do not find as many off-targets as CRISPOR. As we have shown in our paper, CRISPOR finds all off-targets with 4 mismatches. The MIT websites does not find all off-targets, because it filters for repeats. Benchling misses some off-targets, not as many as the MIT website but still a high number. We do not know why, but it may also be related to repeats. Desktop Genetics only can find off-targets with up to three mismatches, so their MIT score is also slightly different.
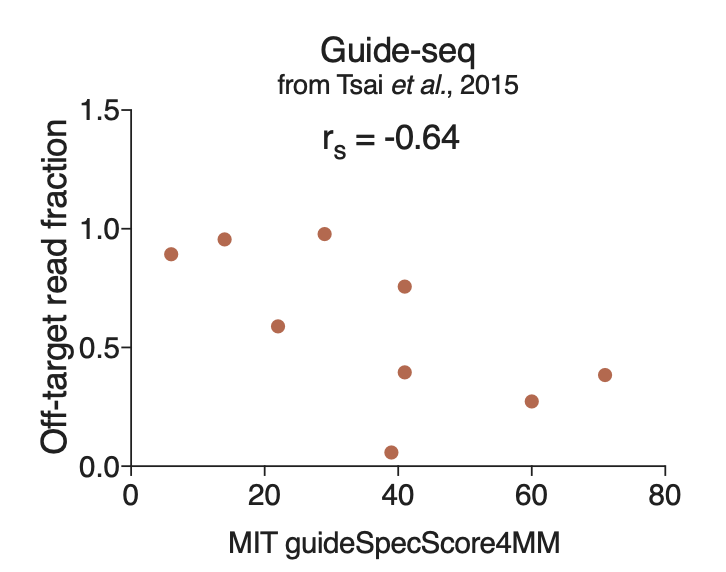
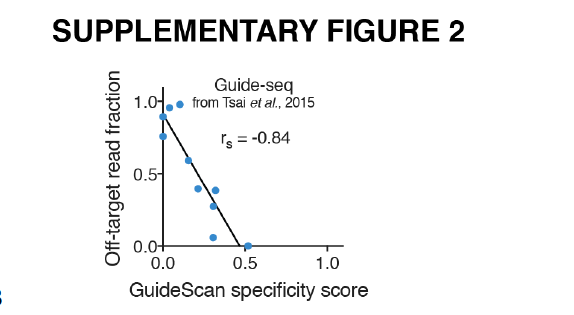
The MIT Guide Specificity score summarizes the individual Hsu MIT off-target scores for all off-targets of a guide, 100/(100+sum(mitScores)). The more recent and more accurate CFD off-target score by Doench et al. is not defined on the level of guides. As a result, the authors of GuideScan.com have inventend a new guide specificity score, by taking the taking the sum of all CFD scores for all off-targets of a guide and taking 100/(100+sum) of that. Since May 2019, we are also showing this score for guides, in addition to the MIT score. This is based on comparisons done by Josh Tycko, shown below, that show a better correlation of the CFD specificty score with total off-target read fraction than with MIT specificity score.
For a given guide, the GuideScan specificity score is not exactly the same as the Crispor CFD specificity score, even though they both use the same formula: CRISPOR considers all genome sites with 4 mismatches as off-targets, where GuideScan uses only 3 mismatches. As shown above and in our paper, we think 4 mismatches is a better parameter for off-target searches than 3.
Of course, just paste the target sequence, i.e. the guide + the PAM sequence, into the sequence input box.
Yes, we can add private genomes. People can use them on the website, but they will not be able to download the genome. Just tell us that the genome is private and shall not be downloadable.
How do I choose the right exon and transcript?
Can you add my genome? By the way, it is 10GB big.
This is tricky. The problem is usually not the size of the genome, but rather the insane number of contigs (often several millions) which makes sequence searches very slow. Searching such a number of sequences takes forever and will make the website unusable for other users. One solution is to reduce the number of contigs, by concatting all smaller ones into a single “chrU” contig, like in the older human genome versions. Another solution is for you to setup your own personal CRISPOR website with just your genome. See the Downloads page at the bottom of the CRISPOR start page to learn more and contact us for help.
Yes, but only with the CRISPOR command line version. It has the –shortGuides option. Look for the command line version on our Downloads page. If you have trouble, email us. Because of their lower efficiency, we do not recommend 19bp long guides and do not offer this option on the website. If you think this is a mistake, let us know.
Nickases are a variant of Cas9 that require two guides with targets very close to each other and both have to cut for a successful genome edit. We have received numerous reports that two guides are a lot less efficient than single guides and less specific than the new high-specificity Cas9 enzymes. We have no plans anymore to support explicit two-guide nickase designs. If you think that this is a mistake, let us know, but for now, we do not recommend the double-guide nickase strategy anymore. We rather recommend eSpCas9 1.1 or SpCas9-HF1 and single guides.
Soren Hough (Univ Cambridge) shares: We often assume we’re working with diploid cells. Unfortunately, that’s often not the case (particularly in cancer research). To help plan our knockout experiments, we sometimes turn to canSAR, a useful database for finding the copy number for a given gene. Here’s an example:
If we were planning to knock out the kinesin gene KIF1A, we’d head to the Copy Number section on the canSAR website: https://cansarblack.icr.ac.uk/target/Q12756/copy-number. At the bottom of that page is a table with each cell line and its reported KIF1A copy number. If I’m working in 786-0 human kidney cells, I can see that there are 4 copies of KIF1A in that cell line. This may mean the gene ends up being more difficult to knock out than if the cell were diploid. Regardless, knowing there are 4 copies will help explain Sanger/TIDE results that show alleles accounting for just 25%, 50% or 75% of a selected monoclonal population. That may mean that only 1, 2 or 3 copies of KIF1A were edited, respectively.